import pandas as pd
import matplotlib as mpl
import matplotlib.pyplot as plt
import numpy as npBook Data Linkage Statistics
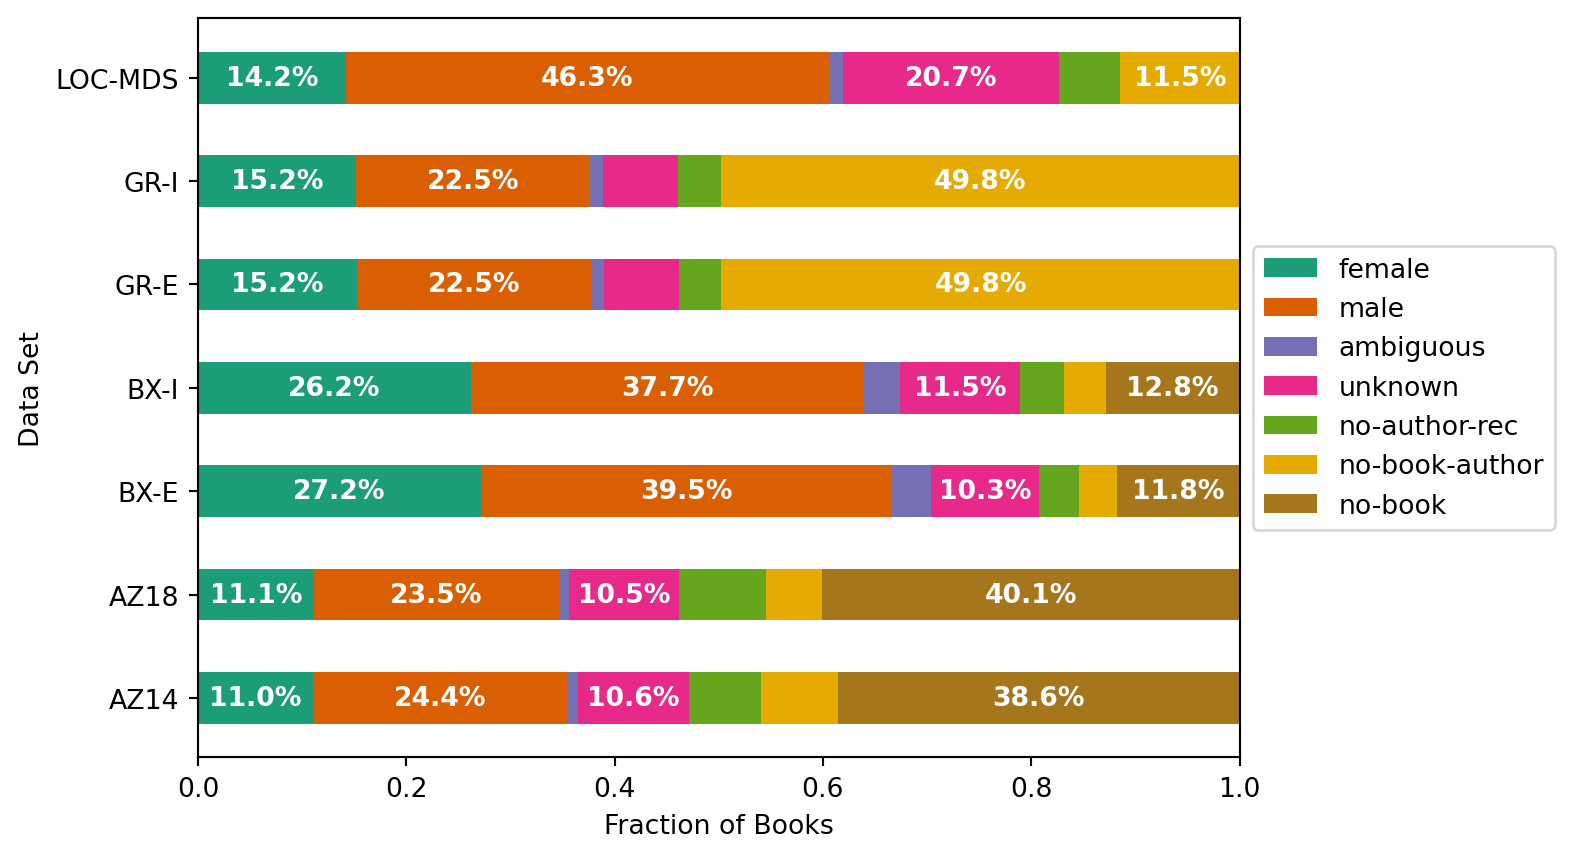
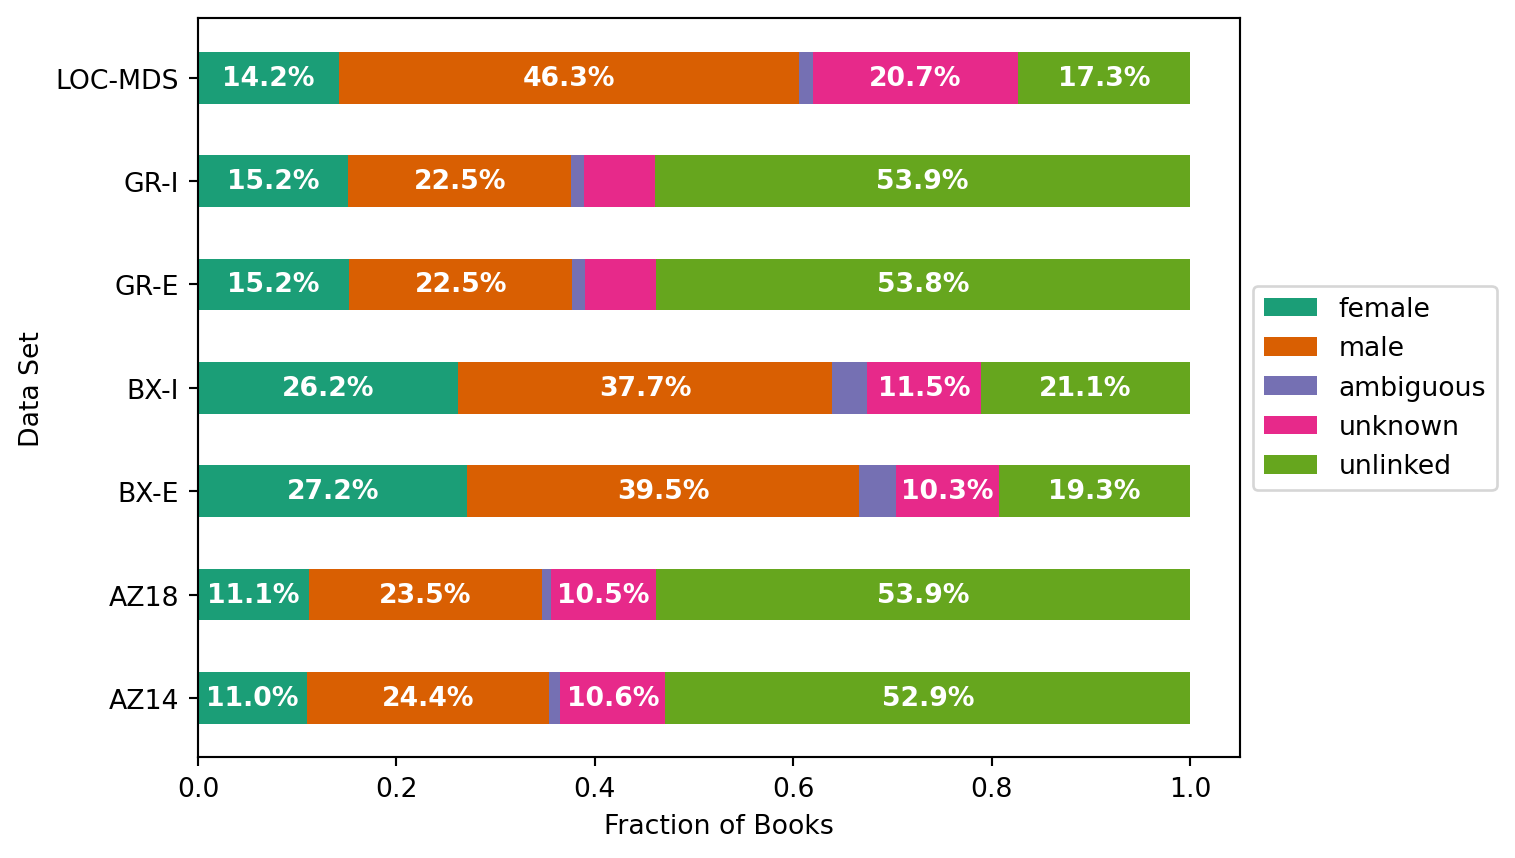
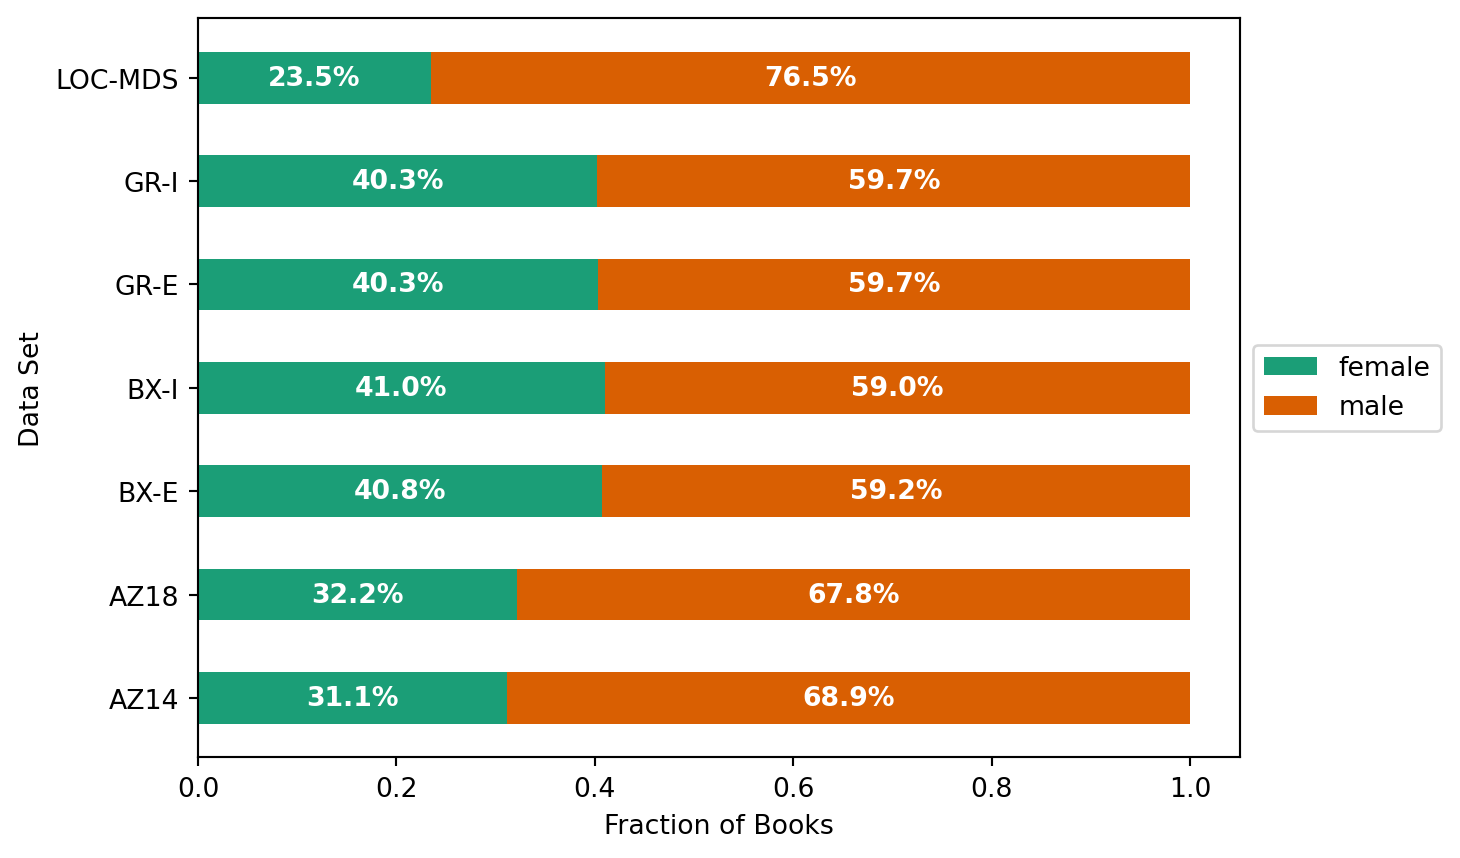
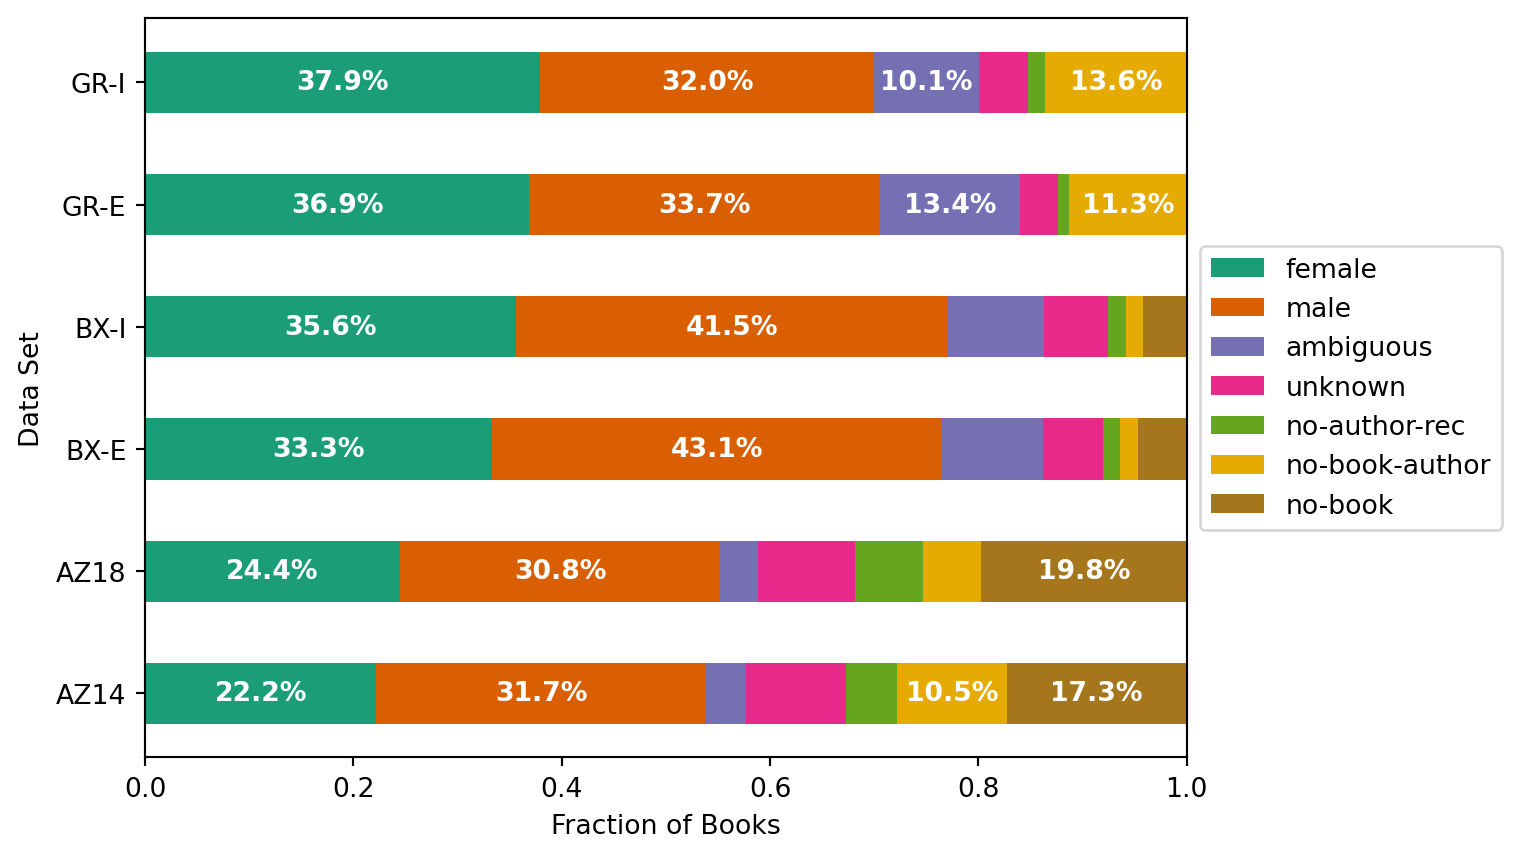
This notebook presents statistics of the book data integration.
Setup
Load Link Stats
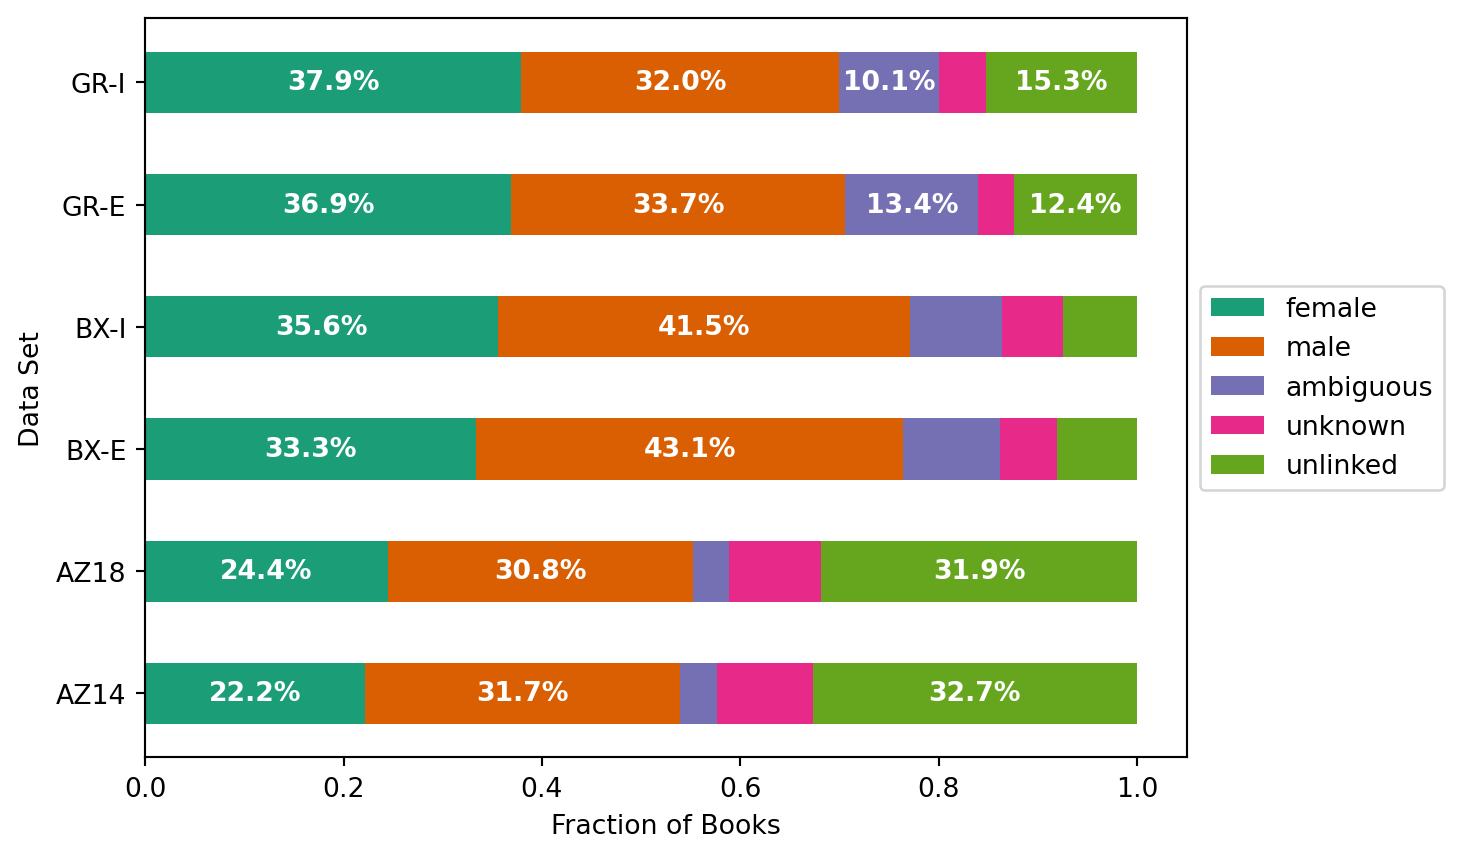
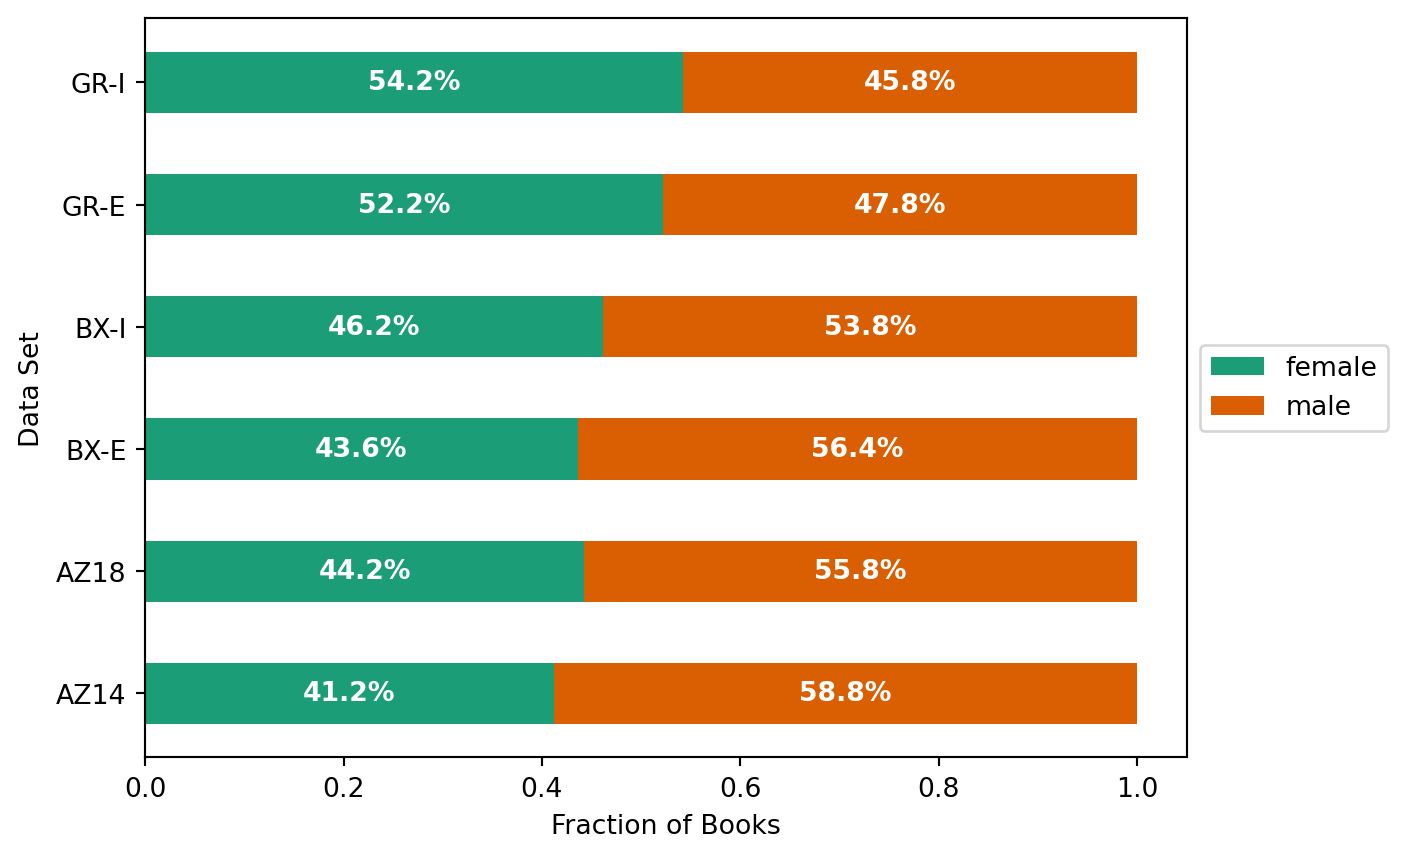
We compute dataset linking statistics as gender-stats.csv as part of the integration. Let’s load those:
link_stats = pd.read_csv('book-links/gender-stats.csv')
link_stats.head()